A Fibonacci Calculator for Retracement and Projections

In finance, Fibonacci analysis, or the “Golden Ratio”, forms the basis of a popular approach to technical analysis. The idea behind Fibonacci analysis is that the price movements of market-traded securities demonstrate relationships to Fibonacci numbers, which start with 0 and form a sequence by summing the previous two numbers in the series. For investors, the importance lies not in the actual numbers in the series, but the ratios between the numbers in the series.
What Are Fibonacci Numbers?
Fibonacci numbers were introduced in 1202 in Leonardo Fibonacci’s (Leonardo da Pisa) book Liber abaci. The Fibonacci number sequence and its applications still fascinate many people today. Fibonacci numbers are those in the following sequence:
0, 1, 1, 2, 3, 5, 8, 13, 21, 34, 55, 89, 144, 233, 377, 610, 987…
The numbers starts with 0 and continue in sequence by adding the previous two numbers in the series. The differences between these numbers are known as Fibonacci Ratios and, for traders, these ratios can be used to help identify possible price support and resistance levels.
To use the calculator below, enter the market high and the market low and click the Update button.
Fibonacci in Technical Analysis
In Fibonacci analysis it is the ratios they offer and their indications for support and resistance that benefit the technical investor. Fibonacci ratios are calculated within the Fibonacci series numbers. The most commonly used ratios for traders are .382%, .50%, .618%, 1.00%, 1.272% and 1.618%.
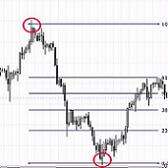
Fibonacci Retracement: A retracement refers to a reversal in the movement of a stock’s price. After a price move from a low to a high, that price will have a tendency to correct or retrace. The percentage of the correction can be .382%, .50%, .618% or even 100% (while 50% is not a Fibonacci ratio it can be extremely useful for traders). Technical investors will look for buying opportunities based on pullbacks when the market is trending up. A Fibonacci tool can help the investor identify the percentage figure as potential price support in deciding whether to take a long position on the stock.
Fibonacci Extension: Extensions are used in reference to all retracements that exceed 100%. The most widely used extensions levels are 161.8%, 261.8% and 423.6%. Technicians use these levels to target pullbacks and place “stops”.
Fibonacci Projection: Projections are used to determine potential price objectives and identify turning points in trends. Fibonacci Projections are used to estimate where the current price move may end.
_________________________________________________________________
The above information is educational and should not be interpreted as financial advice. For advice that is specific to your circumstances, you should consult a financial or tax advisor.
« What is a Systematic Withdrawal Plan? | Home | Calculate and Interpret Pivot Points »


Leave a Comment
You must be logged in to post a comment.