Video Tutorial: The Basic Types of Stock Charts

A stock chart or “price chart” is a graphical illustration of stock prices plotted over a specified period of time. Stock charts are one of the primary tools of technical analysts who study past price behavior in order to predict future price direction. Stock charts can also offer important data to any fundamental analyst who wishes to incorporate the price behavior of a stock under consideration into a final investment decision. While the different types of stock charts all serve the same goal, from a high level, there are significant differences among the three primary types of stock charts.
The Three Main Types of Stock Charts
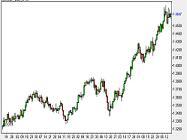
Bar charts: Bar charts are thought to be the most popular of the three types of stock market charts. The creating of a bar chart calls for the high, price, the low price, and the closing price for each time period. Daily charts are used to show data for that trading day; weekly charts show the closing price from Friday of that week along with the high and low prices for that week.
Candlestick charts: A candlestick chart is combines the elements of bar and line charts by demonstrating price movement over time with the high and low trading prices. The construction of a candle includes the body, which illustrates the open and closing prices, and the wick, which shows the highest and lowest prices reached for that trading interval. If the security closes at a higher price than it opened, the body is unfilled. The body is filled in if the security closes at a lower price than it opened, the body is filled in.
Line charts: A line chart offers the most simplistic means of chart reading among the three types as it uses only the closing price of each trading interval. For traders who are concerned only with the closing price, a line chart offers a very clean look.
Click here to launch the Stock Charts Overview Video
The Fundamental Concept of Price Channels
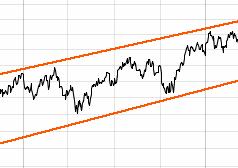
One of the basic elements in chart reading is in identifying price channels or “trading channels”, which create boundaries around levels of volatility for a stock price. Price channels are formed by identifying the number of periods for observation and charting the high and low price lines within that period.

________________________________________________________________
The above information is educational and should not be interpreted as financial advice. For advice that is specific to your circumstances, you should consult a financial or tax advisor.
« Free Guide: Learn the Basics of Fundamental Analysis | Home | When and Why to Invest in Cyclical Stocks »


Leave a Comment
You must be logged in to post a comment.