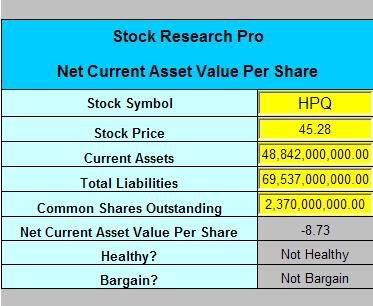
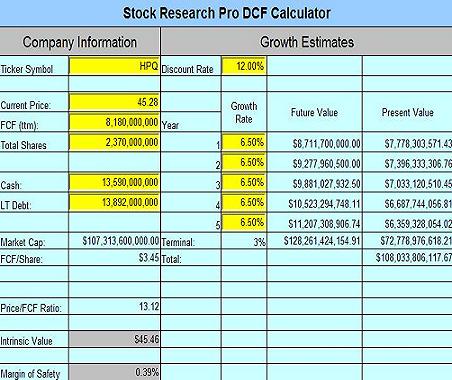
We ran the following financial health and stock valuation analysis using the SRP Valuation software package from Stock Research Pro.
Disclaimer: This is not a recommendation of any kind regarding the purchase or any action on this stock. It is up to you, the investor, to make your own assessments and investment decisions.

Date: 10/3/09
Company Description: Hewlett Packard, with headquarters in Palo Alto, CA, offers products, software, and technologies to consumers, business of all sizes, and government entities. The company operates in divisions that include Enterprise Storage and Servers, HP Services, HP software, Personal Systems, Imaging and Printing, and Financial Services.
Sector: Technology
Industry: Diversified Computer Systems
Main Competitors: Dell (DELL), Microsoft (MSFT), Apple (AAPL)
Financial Ratios
Liquidity: Current Ratio 1.17
Comment: Greater than 1.0, Indicates the company is able to meet is short-term debt obligations.
Leverage: Debt/ Equity .41
Comment: Less than the 1.0 maximum established by many investors in this sector but higher than industry competitors MSFT and AAPL who carry no long-term debt.
Profitability: Return on Equity (ROE) 18.3%
Comment: Less than 20%, ROE does not meet criteria often looked for by growth investors and lower than primary competitors.
Efficiency: Asset Turnover 24.71%
Comment: Lower than primary industry competitors
Income: Dividend Yield .70%
Comment: Greater than industry competitor AAPL, which does not pay a dividend, but lower than industry competitor MSFT (2.04%).
Valuation: Price/Earnings (P/E) 15.25
Comment: Significantly lower than industry competitor AAPL (32.41); in line with other industry competitors and lower than maximum P/E for many value investors (20).
Financial Strength Analysis: NCAVPS
We also used the SRP Valuation software to run a Graham Net Current Asset Value per Share (NCAVPS) analysis, comparing current assets to total liabilities to further assess financial health. HPQ currently calculates as “Not Healthy” against this very strict measure.

Valuation Analysis
Discounted Cash Flow: Discounted Cash Flow (DCF) analysis is a measure for arriving at the fair market value of a stock under the assumption that the real or “intrinsic” value of a stock is derived by summing discounted future cash flows. The SRP Valuation software leverages a company’s free cash flow, evaluating expected growth over the next five years and terminating at 3% (average overall economic growth) thereafter.

Assuming a discount rate of 12%, Hewlett Packard will need to achieve average five-year growth of about 6.5% to be fairly valued today.
Analyst Growth Estimates: Next Five Years, 9.94%. Click here for details.
Re-running the DCF analysis with all other factors held consistent and plugging in the analyst forecasted growth rate of 9.94% over five years calculates an intrinsic value of $52.20 for a current margin of safey of 15.28%.
My Thoughts: Disappointing ROE for growth and weak return for income-oriented investors. Balance sheet could be stronger. No place for it in my portfolio.
-Steve
Click here to download and try to the SRP Valuation and
Stock Research Pro software packages.
_______________________________________________________________
The above information is educational and should not be interpreted as financial advice. For advice that is specific to your circumstances, you should consult a financial or tax advisor.


Great Blog post. I am going to bookmark and read more often. I love the Blog template if you need any assistance customizing it let me know!
Nice writing. You are on my RSS reader now so I can read more from you down the road.
Allen Taylor